Distribution models provide a bird’s eye view of forest restoration
What exactly is a bird’s eye view of the forest?
Contributed by our partner Caitlyn Gillespie with the Klamath Bird Observatory
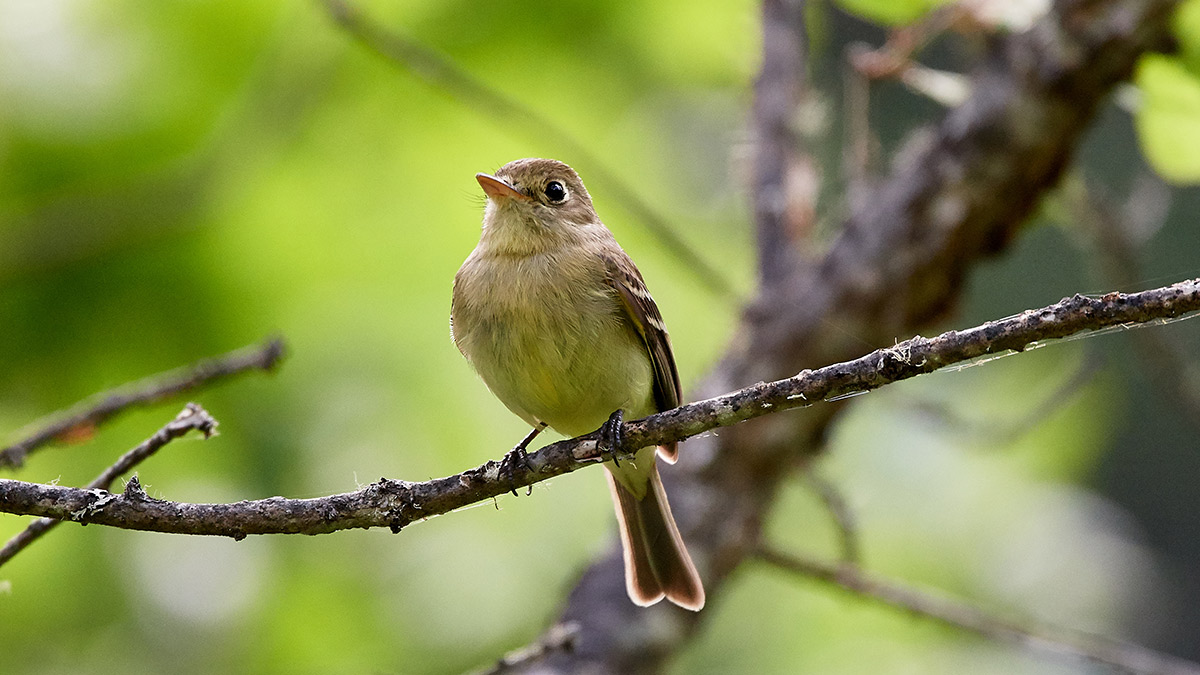
![]() At Klamath Bird Observatory, we frequently tell the story of birds knowing our forests better than we do. Using birds as indicators, we’ve applied our science across the diverse and beautiful Klamath-Siskiyou bioregion to understand the ecological change from a bird’s perspective and used that information to inform conservation planning and restoration design. But what exactly is a bird’s eye view of the forest? When we see a forest, we see trees, shrubs, and grasses; we notice how dense the vegetation grows and how old the trees are. Birds see all of these things too, but individual species also hone in on specific features—snags, downed logs, openness or tightness of a canopy, the size of the patch of forest, or how close it is to a stream. We already use much of what we know about birds and habitats in conservation planning. Our work with the Rogue Forest Partners has provided a recent application for using birds as indicators in planning for the future health of our forests.
At Klamath Bird Observatory, we frequently tell the story of birds knowing our forests better than we do. Using birds as indicators, we’ve applied our science across the diverse and beautiful Klamath-Siskiyou bioregion to understand the ecological change from a bird’s perspective and used that information to inform conservation planning and restoration design. But what exactly is a bird’s eye view of the forest? When we see a forest, we see trees, shrubs, and grasses; we notice how dense the vegetation grows and how old the trees are. Birds see all of these things too, but individual species also hone in on specific features—snags, downed logs, openness or tightness of a canopy, the size of the patch of forest, or how close it is to a stream. We already use much of what we know about birds and habitats in conservation planning. Our work with the Rogue Forest Partners has provided a recent application for using birds as indicators in planning for the future health of our forests.
With new statistical tools, we can more effectively picture what a bird “sees” and how habitat is distributed across a landscape. Distribution modeling is the process by which a dataset of bird presences and absences from multiple surveys is paired with data about the landscape where the surveys took place. We get data about the landscape from satellite imagery known as Landsat, which measures and reports the reflected light, like a photo, but using more wavelengths, including some invisible to the human eye. “Species-centered” distribution modeling (named for its focus on what the bird sees in the landscape, instead of how people quantify it into vegetation types) uses the information from the surveys and data from the Landsat images to determine what features of the landscape best predict whether a species will be found there.
Unlike simply measuring bird presence directly with a survey, the species-centered models allow researchers to study larger areas and glean more information about where the potential habitat for a species is most likely to occur, even in places where surveys haven’t taken place or where the forest habitat features have not been quantified.

Once the models are created, they have a multitude of applications. A recent study by KBO scientists in partnership with OSU used species-centered distribution models “stacked” on top of one another to understand the effects of habitat fragmentation on bird diversity.
Species-centered distribution models can also help us understand the broad landscape-scale impact of disturbances such as wildfire or restoration treatments such as prescribed thinning and burning.
Since data from Landsat images are available every year, KBO scientists are beginning to test how species-centered distribution models can be applied to assess the effects of restoration treatments on bird habitat over time. For example, we have recently applied distribution models to examine a natural disturbance and recent restoration work in the Rogue Basin. The Quartz Fire, which burned in 2001, was studied using point count data in 2015. Using species distribution models and Landsat from the years before and after the fire, we were able to not only confirm results from our bird survey analysis, but also extract more data points to further our work examining differences among bird communities in low, moderate, and high severity burned areas following the fire.
In the Ashland Watershed, we used the models for 41 songbird species and Landsat imagery from 2004 (before any work took place) and 2019 (after the treatments were completed), we were able to quantify how the bird community changed following those treatments and evaluate whether restoration goals were achieved.
The ability to quantify changes in forest conditions using models, instead of solely monitoring birds directly at a given location, offers efficiencies for expanding the scope and scale of existing bird monitoring efforts to assess ecological change in the places we study. Our ongoing collaboration with Rogue Forest Partners provides an immediate, relevant application for the models, as restorative forest treatments are planned for the next decade to make forests more resilient and communities safe from wildfire. We monitor some of these treatments with bird surveys, but models provide another way to quantify that change across large landscapes that would be financially and logistically challenging to survey directly.
Over time, we can also measure how the forest grows back year after year and assess how bird habitat develops. For example, are the indicator species we expected to see following treatments likely to be there now? Are some species likely to occur in some areas that received a particular ecological thinning prescription more than other areas with a different approach? Does the presence of a species depend on how much of the landscape was treated? By asking these kinds of questions, distribution models provide “snapshots” of the ongoing restoration work that is vitally needed in our forests, help biologists assess habitat change over time and inform the design and implementation of future restoration treatments.